
StoriesAnalysis
Analysis: What USDA Data Actually Says About Farmers Markets Today
Four USDA datasets count farmers markets in four different ways, and none of them shows the boom still running. Here are the numbers as published, what each one measures, and what they suggest for a vendor deciding where to sell.
 United Farmers Market Editorial Team
In this guide
- Four USDA numbers that are not the same number
- The directory, and how the 8,000 number was built
- The managers survey: what an average market looks like
- The sales survey: where direct-to-consumer dollars actually go
- The census: the widest net and the longest tail
- What this suggests for vendors, and what it doesn't
The most quoted farmers market statistic in America is a directory count, and it points the wrong way for a headline. If you sell at a market or want to, you have seen "more than 8,000 farmers markets" in a grant application or a market's brochure. It comes from a USDA listing service: voluntary, self-reported, and ending its published series at a 2019 high that today's live count sits well below.
Three other USDA datasets say more. One surveyed market managers; two counted farm sales. This piece reports all four as published, explains what each measures and where it falls short, then says what we think they mean for someone behind a table. It is analysis, not reporting: we surveyed no one, and where a figure allows two readings, we say so.
Four USDA numbers that are not the same number
| Source | What it counts | Latest published figure |
|---|---|---|
| AMS National Farmers Market Directory | Voluntary listings of markets with two or more farm vendors at a recurring location | 7,148 listings (September 2, 2026); series high of 8,771 (2019) |
| NASS Farmers Market Managers Survey | Statistical estimate of operating markets, from a sample of 10,000 | 8,140 markets (2019) |
| NASS Local Food Marketing Practices Survey | Farm food sales by channel, from a sample of farms | $514 million through farmers markets (2020) |
| Census of Agriculture | Every farm's value of food sold directly to consumers | 116,617 farms, $3.3 billion (2022) |
The first two count places. The other two count farms and dollars, and cannot see a market as a place. Most misuse of these figures comes from treating them as one series.
The directory, and how the 8,000 number was built
The Agricultural Marketing Service defines a listing in its National Farmers Market Directory as a market with "two or more farm vendors selling agricultural products directly to customers at a common, recurrent physical location." AMS's published count of those listings goes back to 1994 and is the source of nearly every "number of farmers markets" you have read.
The series runs 1,755 listings in 1994, 4,685 in 2008, 7,864 in 2012, 8,268 in 2014, and 8,771 in 2019. The count grew about 74 percent in five years, from 4,685 in 2008 to 8,144 in 2013. From 2014 to 2019 it grew about 6 percent in total, and the last year on the chart added 0.6 percent. The boom our short history of American farmers markets describes had flattened by the middle of the last decade.
Then read the line printed under the chart: "Farmers Market information is voluntary and self-reported to USDA-AMS-Marketing Services Division." The Local Food Directories portal invites operators to list a business and submit edits, and nothing in the count confirms a listed market opened this season. A market that folded stays listed until someone removes it. On September 2, 2026 the portal showed 7,148 farmers market listings, plus 4,692 on-farm markets and 480 food hubs.
That is 1,623 fewer than the 2019 figure, and we cannot say how many are closures. AMS has since moved the directories to a platform its page calls the "new and improved Local Food Directories," and an entry nobody carried over looks exactly like a market that shut down. The directory supports a narrower claim: the era of a new market opening every week ended around 2013, well before the platform changed.
The managers survey: what an average market looks like
For the 2019 season, the National Agricultural Statistics Service did what the directory cannot: it surveyed markets. The National Farmers Market Managers summary, released in August 2020, drew 10,000 markets from the AMS directory plus a web-scraped list, got a 58.8 percent response rate, and used a capture-recapture adjustment to estimate the markets neither list had.
The result was 8,140 markets operating in 2019, about 7 percent fewer than the 8,771 listings the directory carried that year. That gap measures how much air was in the directory even at its high point.
The per-market averages are worth taping to the wall:
- 25 vendors on a peak market day. Separately, 23 returning vendors, and 14 who sold products they produced. Three sold bread and baked goods, nine fruit and vegetables; the categories overlap, since one vendor can sell several.
- 916 households shopped on an average market day, and the market took in $14,547. Dividing one by the other is crude, and big city markets pull both up, but it puts a typical vendor's day in the hundreds, not thousands.
- 36.8 percent of markets had more vendors on an average market day than in 2018, 51.8 percent the same number, and 11.4 percent fewer.
- 6,389 of the 8,140 markets charged vendors to sell, 74.4 percent of those at a flat rate. Separately, 35.2 percent of all markets charged an annual membership or application fee.
- 4,076 markets, almost exactly half, accepted federal nutrition benefits, and 78.7 percent of those accepted SNAP.
Put the peak-day average next to the returning-vendor average and the difference is about two stalls. NASS publishes no turnover rate, but that gap explains why applications feel competitive, and it is the premise of our guide to finding the right market for what you sell.
The sales survey: where direct-to-consumer dollars actually go
The Local Food Marketing Practices Survey is a special study attached to the Census of Agriculture. Its 2020 edition, published in April 2022 from a sample of 64,540 farms, found 147,307 farms selling $9.0 billion of food through direct channels, up from $8.7 billion in 2015 while the farm count fell 12 percent from 167,009. "Direct" means to consumers, retailers, institutions, and local intermediaries such as food hubs. "Local" means transported less than 400 miles or sold within the state.
Direct-to-consumer sales were $2.9 billion of that, a third of the total, from 113,400 farms. The 2015 and 2020 editions split those sales across the same six channels, the only USDA breakdown we found that puts a dollar figure on farmers markets.
| Channel | 2015 sales ($ million) | 2015 farms | 2020 sales ($ million) | 2020 farms |
|---|---|---|---|---|
| On-farm store or stand | 1,322 | 51,422 | 1,231 | 49,503 |
| Farmers market | 711 | 41,156 | 514 | 28,094 |
| Stand or store away from the farm | 236 | 14,959 | 252 | 14,380 |
| CSA | 226 | 7,398 | 225 | 7,244 |
| Online | 172 | 9,460 | 312 | 15,887 |
| Other (pick-your-own, mobile market) | 360 | 39,765 | 415 | 47,241 |
| Total direct to consumer | 3,027 | 114,801 | 2,950 | 113,400 |
Farm sales at farmers markets fell 28 percent in five years, and the number of farms selling there fell 32 percent. Online sales rose 81 percent. No other channel moved more than 16 percent. Farms appear in more than one row, so the channels do not sum to the total.
Now the caveats, because they are large. The reference year is 2020. NASS went back into the field in late 2021 to reach producers it had missed, citing "the extreme dynamics of the COVID-19 pandemic," and some of the online growth was surely farms replacing a disrupted market day with a web order form. The survey cannot say how much of that stuck, and it carries sampling error. It counts farms only, so a baker who buys flour and sells at the same market is not in it: the $514 million is farm sales at markets, not what markets sold.
Three more findings matter for sellers. Twenty-seven percent of farms selling at a farmers market accepted SNAP in 2020, up from 19 percent in 2015. Among farms selling direct to consumers, 75 percent sold processed or value-added products and 42 percent sold fresh food, though by dollars the split ran the other way: 52 percent of direct-to-consumer sales were fresh commodities. And operations with $500,000 or more in direct food sales were 2 percent of direct-marketing farms but took 55 percent of the income.
The census: the widest net and the longest tail
The 2022 Census of Agriculture, released in February 2024, asks every farm for the value of food it sold directly to consumers. That sum is the $3.3 billion in the press releases, from 116,617 farms. The national table puts it at $3,263,074,000, up 16 percent from $2,805,310,000 in 2017, while the number of farms fell from 130,056. Average sales per farm: $27,981.
The Economic Research Service ran the inflation adjustment and found direct-to-consumer sales flat against 2017 in real terms. The growth is one step up the chain: 60,332 farms sold $14.2 billion to retailers, institutions, and food hubs in 2022, more than double the number selling that way in 2017, and total direct sales of $17.5 billion were up 25 percent after inflation.
The row a vendor should read is the breakdown by size, which the press releases skip.
| Direct-to-consumer sales per farm, 2022 | Farms | Share of farms | Share of dollars |
|---|---|---|---|
| Under $5,000 | 79,330 | 68% | 3% |
| $5,000 to $49,999 | 28,818 | 25% | 13% |
| $50,000 or more | 8,469 | 7% | 84% |
The shares are our arithmetic on the published rows. Two-thirds of American farms selling directly to consumers gross less than $5,000 a year doing it. Clear $8,000 in a season and you are above most of them.
The census has limits too. It asks only for the total, so it cannot separate a farmers market from a farm stand or a website, and a farm selling at three markets is one row. Its definitions also differ from the sales survey's, so the census's $3.3 billion for 2022 and the survey's $2.9 billion for 2020 are two measurements, not a trend.
What this suggests for vendors, and what it doesn't
A stall is a scarce seat, not a growth market. Markets stopped multiplying around 2013, and the average market's returning-vendor count is two below its peak-day count. Apply early, apply to more than one market, and read a waitlist as a real queue.
The market is the shop window, not the whole store. Online grew 81 percent between 2015 and 2020, faster than any other direct-to-consumer channel. A cottage food seller cannot always follow: state law decides whether you may ship or take web orders, which we sort out in our guide to selling cottage food online. Where it is allowed, a pre-order list is not a side project.
Most direct sellers are small, so price like a business anyway. Two-thirds of direct-selling farms gross under $5,000, and an average market day's $14,547 is split among 25 vendors. Volume will not rescue a thin margin, which is where our pricing method starts.
Federal nutrition benefits reached half of markets in 2019. With 4,076 markets accepting them and farm-vendor SNAP acceptance up from 19 to 27 percent, benefits customers are part of the shopper base at many markets. Which of your products qualify is a question for the market and the state; our payments guide walks through it.
The value-added table is the crowded table. Three-quarters of direct-selling farms sell processed products, and the average market counted 25 vendors on a peak day but only 14 selling something they produced. Add the non-farm bakers and preservers that expanding cottage food laws brought to the same tables, a shift we trace in how cottage food laws have expanded, and the jam-and-bread corner is more contested than the produce rows.
What the numbers do not say: they do not measure shopper demand or the health of the market nearest you, and national averages hide the regional spread. The 11-state Northeast took 28 percent of direct farm sales in 2020, California alone 16 percent. No federal source identifies cottage food vendors either: the farm surveys count farms, and the managers survey counts every vendor without asking whether they farm.
So when a claim about farmers markets cites USDA data, ask three questions: which source, what year, and whether it counts places, farms, or dollars. Most claims fall apart at the second question.
Sources and further reading
- 1.Local Food Directories: National Farmers Market Directory · USDA Agricultural Marketing Service · accessed Sep 2, 2026 · Directory definition (two or more farm vendors at a common, recurrent physical location); announcement of the rebuilt Local Food Directories
- 2.National Count of Farmers Market Directory Listings, 1994-2019 · USDA Agricultural Marketing Service, Marketing Services Division · accessed Sep 2, 2026 · Annual listing counts from 1,755 (1994) to 8,771 (2019), including 8,144 (2013) and 8,268 (2014); the 0.6 percent 2018-to-2019 increase; the voluntary and self-reported footnote
- 3.USDA Local Food Directories · USDA Agricultural Marketing Service · accessed Sep 2, 2026 · Live listing totals on the access date: 7,148 farmers markets, 4,692 on-farm markets, 480 food hubs; the portal's invitation to list a business and submit listing edits
- 4.National Farmers Market Managers, 2019 Summary (August 2020) · USDA National Agricultural Statistics Service · accessed Sep 2, 2026 · 8,140 markets; 25 vendors on a peak day, 23 returning, 14 selling products they produced; 916 households and $14,547 per market day; fee and nutrition-benefit tables; sample of 10,000, 58.8 percent response
- 5.Direct Farm Sales of Food: Results from the 2020 Local Food Marketing Practices Survey (ACH17-27) · USDA National Agricultural Statistics Service · accessed Sep 2, 2026 · 147,307 farms and $9 billion; direct-to-consumer sales by marketing practice; 2020 versus 2015 by buyer type; 42 percent fresh and 75 percent processed among direct-to-consumer farms, with 52 percent of those sales fresh; regional shares
- 6.2020 Local Food Marketing Practices Survey: Executive Briefing · USDA National Agricultural Statistics Service · accessed Sep 2, 2026 · Definition of local; sample of 64,540; 167,009 operations in 2015; 113,400 direct-to-consumer farms and 2020 farm counts by marketing practice; SNAP 27 versus 19 percent; the $500,000-and-over concentration
- 7.Direct Farm Sales of Food: Results from the 2015 Local Food Marketing Practices Survey (ACH12-35) · USDA National Agricultural Statistics Service · accessed Sep 2, 2026 · 2015 direct-to-consumer sales by marketing practice with farm counts (Table 2), including $711 million and 41,156 farms for farmers markets
- 8.USDA NASS to Collect Additional Information on 2020 Local Foods Marketing Practices Survey (notice, October 15, 2021) · USDA National Agricultural Statistics Service · accessed Sep 2, 2026 · Additional 2021 data collection justified by 'the extreme dynamics of the COVID-19 pandemic'; supports the 2020 reference-year caveat
- 9.USDA Releases Local Food Marketing Practices Data (news release, April 28, 2022) · USDA National Agricultural Statistics Service · accessed Sep 2, 2026 · Release date of the 2020 survey results and the totals by type of buyer
- 10.USDA Releases 2022 Census of Agriculture Data (news release, February 13, 2024) · USDA National Agricultural Statistics Service · accessed Sep 2, 2026 · 1.9 million farms, down 7 percent; 116,617 farms sold directly to consumers, $3.3 billion, up 16 percent from 2017
- 11.2022 Census of Agriculture, United States Data, Table 2: Market Value of Agricultural Products Sold Including Landlord's Share, Food Marketing Practices, and Value-Added Products: 2022 and 2017 · USDA National Agricultural Statistics Service · accessed Sep 2, 2026 · Direct-to-consumer farms and dollars for 2022 and 2017, average per farm, and the breakdown by value of sales; the direct-to-retail, institution, and food hub rows
- 12.Agricultural Census shows strong growth in direct sales from farms and ranches (Chart of Note, March 21, 2024) · USDA Economic Research Service · accessed Sep 2, 2026 · Inflation-adjusted comparison of 2022 and 2017: direct-to-consumer sales flat in real terms, total direct sales up 25 percent, and a doubling of operations selling to retail, institutions, and intermediate markets
Weekly newsletter
Market Dispatch
One email a week with the newest guide, what's in season, and a few things worth knowing before market day.
Email subscriptions are not open yet. Read every new story through our free RSS feed.
Follow Market Dispatch via RSS →Keep reading
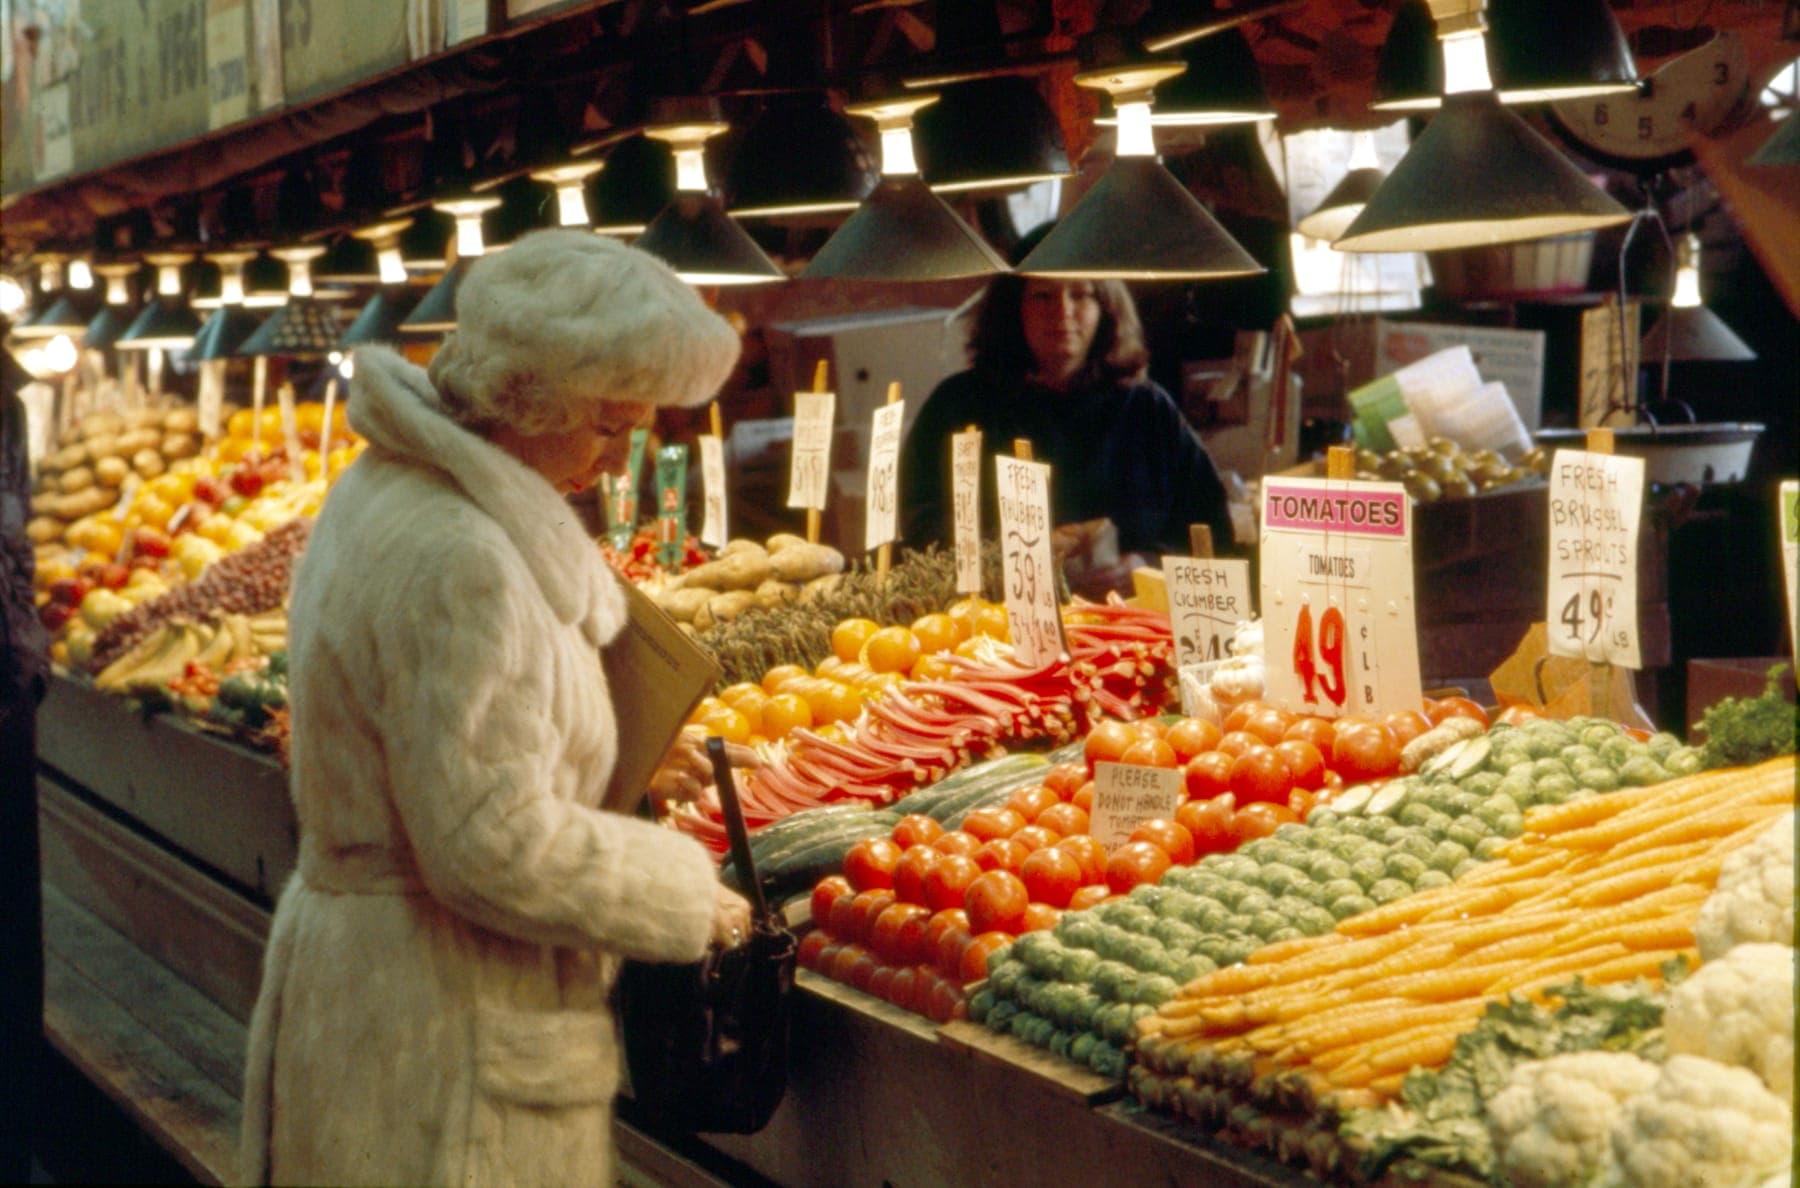
A Short History of the American Farmers Market
The farmers market is older than the country, and for most of its life it was a city service, not a movement. How public markets were built, nearly abandoned, written into federal law in 1976, and rebuilt as the nonprofit, mostly tent-based markets we sell and shop at today.
· 9 min read
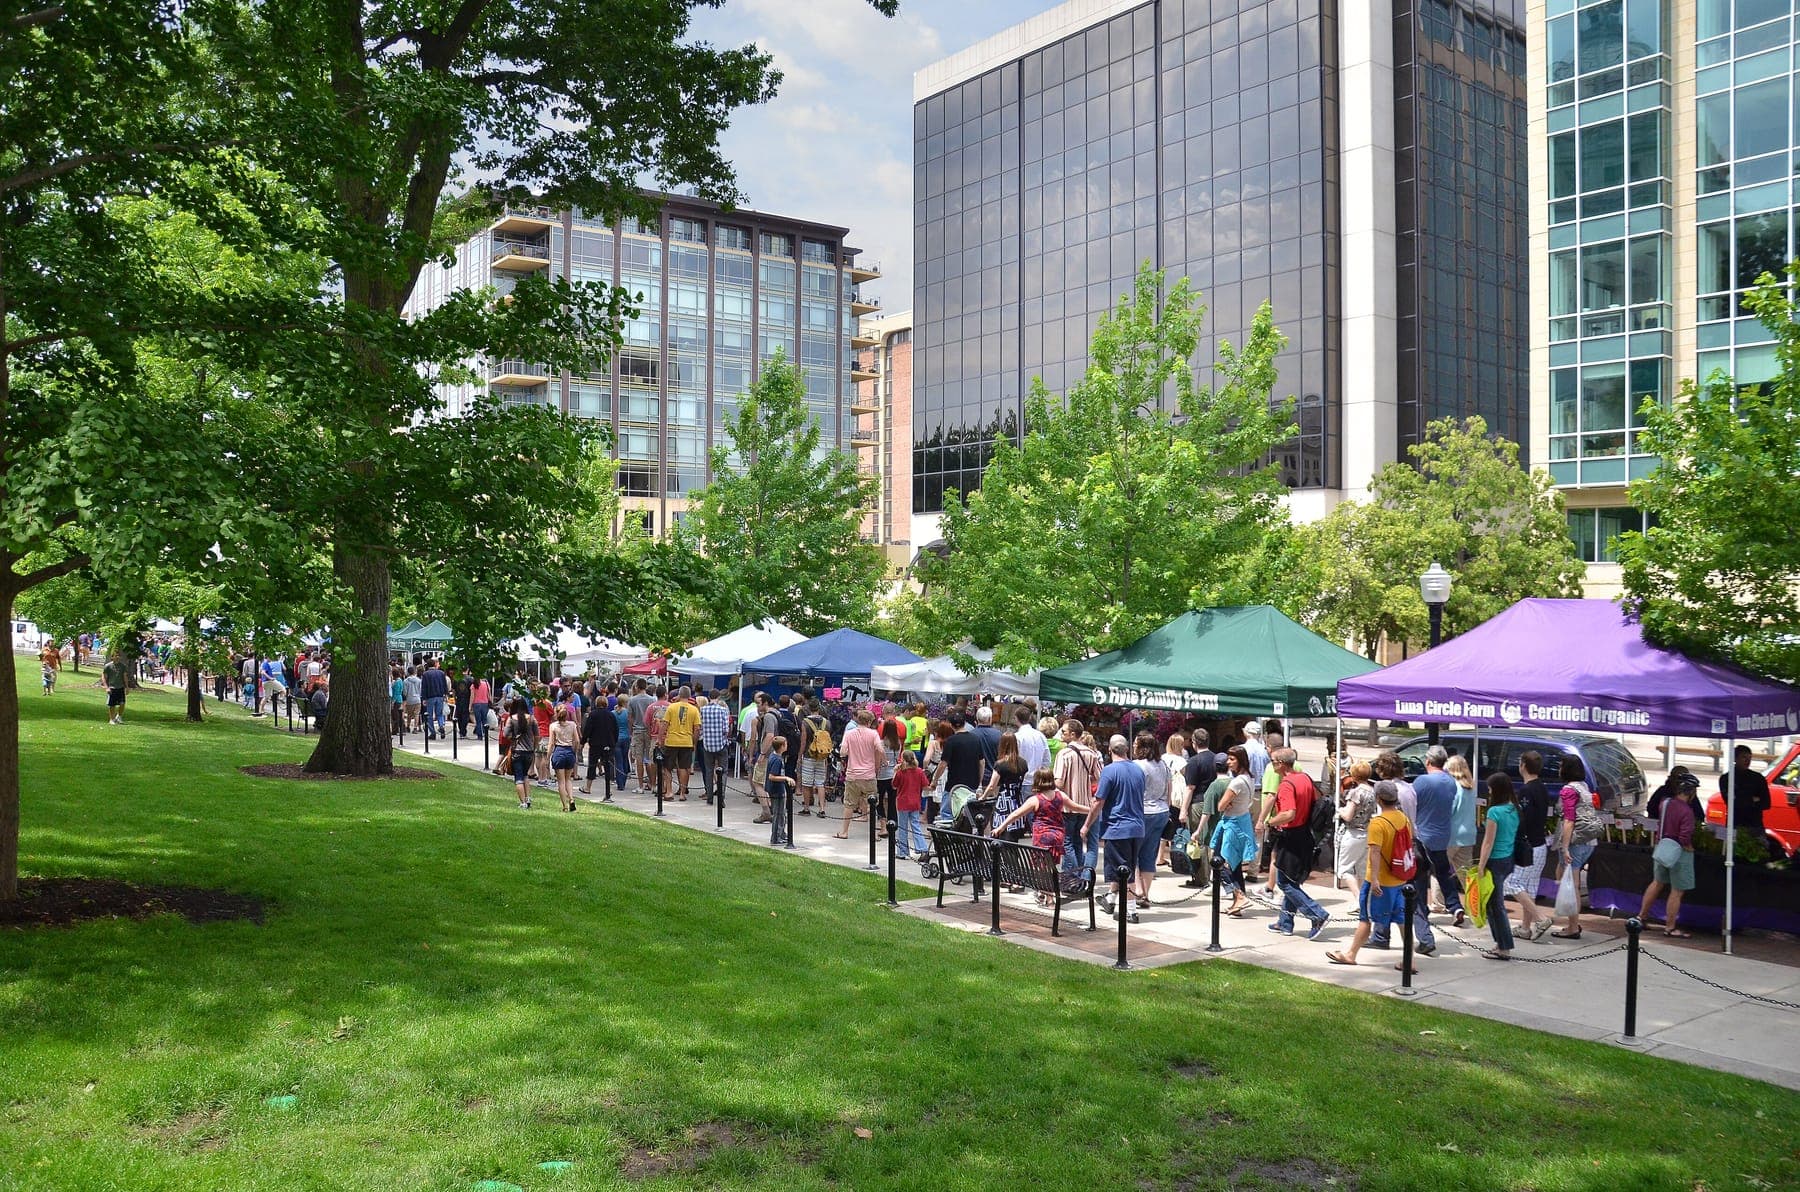
How to Find the Right Farmers Market for What You Sell
The USDA directory alone lists more than 7,000 farmers markets. Here is where to look, what a listing cannot tell you, and how two visits as a shopper and one conversation with the manager reveal whether a market actually needs what you make.
· 8 min read